View the Noise and operations data
The Airport Noise and Operations Monitoring System (ANOMS) is operational 24 hours a day, 7 days a week, continuously tracking and recording noise levels and aircraft flights to and from the airport. The system uses data collected from air traffic control radar systems, airport data feeds, and noise monitoring terminals to build a detailed picture of the noise level produced by flights operating around the airport. All of the collected data is analyzed and presented in the report below.

Aircraft Noise Summary
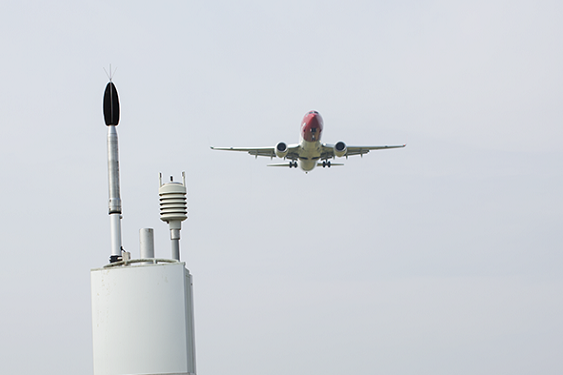
The airport has a number of fixed or temporary noise monitors deployed in the local area, generally under or near flight paths.
The data collected by the monitors is presented in the following dashboard which displays:
- The location of the noise monitors
- Detailed information on the collected noise data, including the distribution of peak noise events and if these were caused by arrivals or departures.
- The top noise-producing aircraft and airlines for the selected time period and filters.
Learn more about how aircraft noise is monitored and captured.

Operational Summary and Directional Flow Summary
These dashboards show the number of operations per day and per runway based on a variety of parameters:
- Period: provides a deep dive into the number of operations at the airport per day and per month.
- Select: the report data can be filtered by time of day and operation type (arrivals or departures).
- Category: summarises the number of flights at the airport for the top 15 airlines, aircraft types, and destinations.
- Trend: outlines how the number of operations per day per month compares in the selected month to the past 2 full years.
View the Data
The dashboard below is automatically updated every month and you can access data from previous months using the drop-down in the center of the report header.
User Notes:
Click the page navigation buttons to view the Aircraft Noise Summary, Operational Summary, and Directional Flow Summary. You can view the dashboard in full-screen mode by clicking the box in the upper right corner of the dashboard window.

Want to see more?
View live flight tracks and noise levels using our WebTrak Flight and Noise tracker.